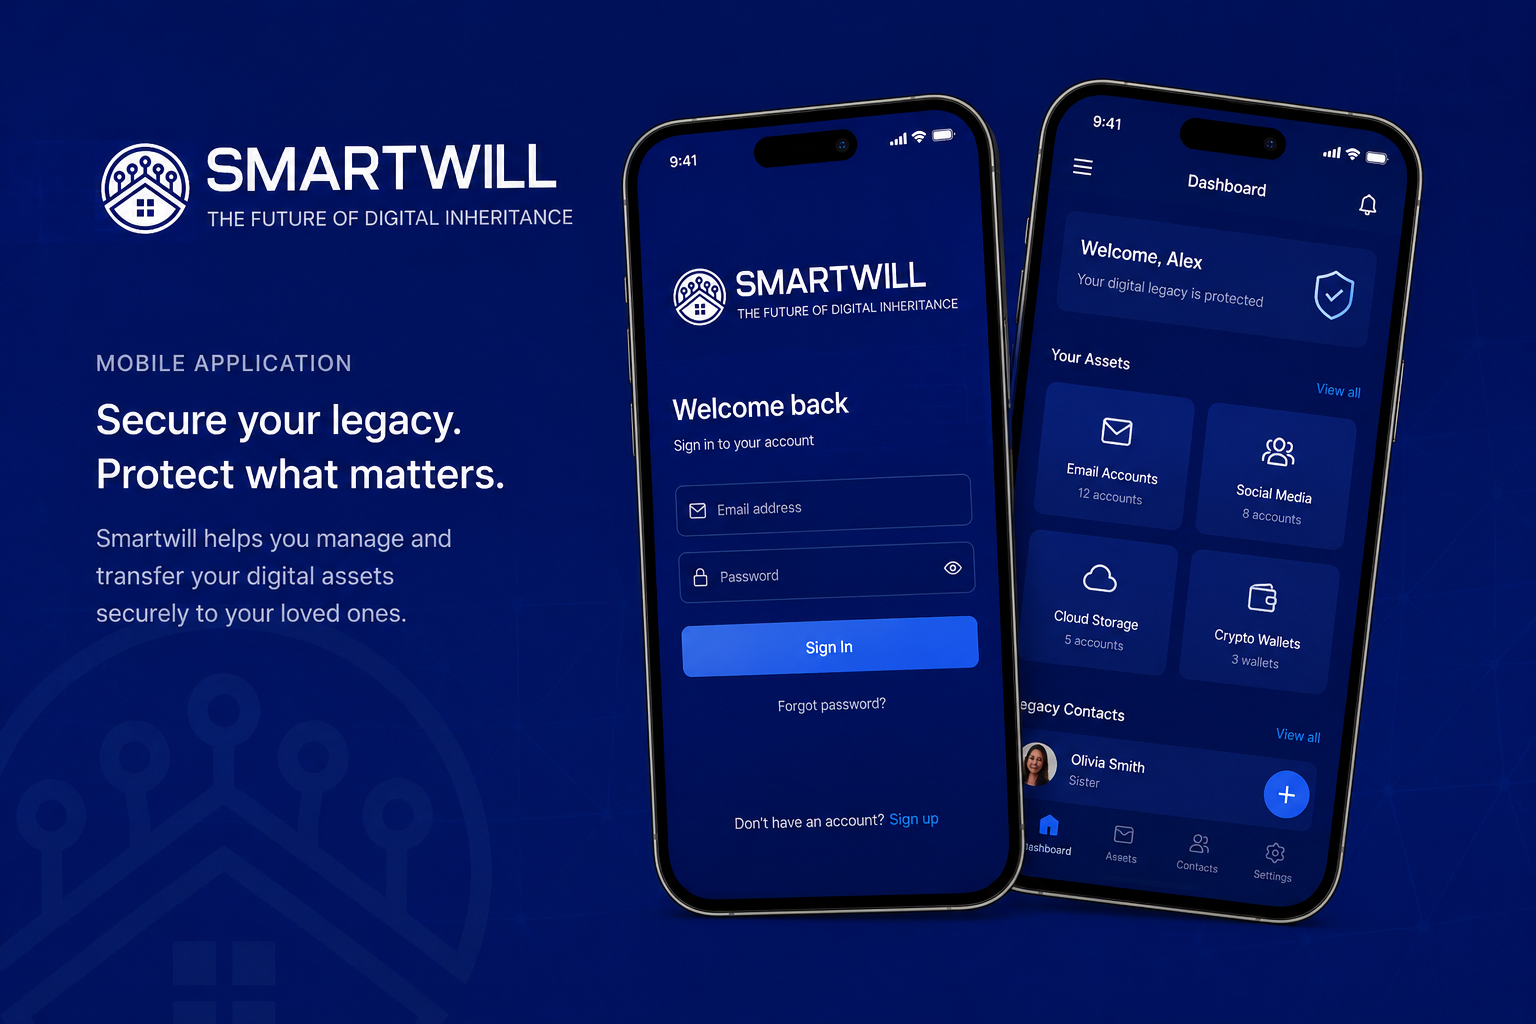
SAP to open-stack ERP migration
Manufacturer, 500+ employees. Phased migration off SAP ERP onto an open stack with custom modules — run in stages while the plant kept working.
- 0 downtime
- 8 mo migration
- −40% on licences

Every agency claims a multiplier. Almost none publishes what they measured, against which baseline, on how many projects. This page publishes the method first and the numbers second.
What we can show you
Every agency claims a multiplier. Almost none publishes what they measured, against which baseline, on how many projects.
AI-accelerated, senior-reviewed. On the code-writing share we are typically 2–4× faster than our own pre-AI baseline. Typical full-project savings: 30–50%.
That sentence is the only performance claim we make anywhere on this site. If you ever see a bigger number from us without a method next to it, treat it as a mistake and tell us.
Cadence
Quarterly
Baseline
Our own pre-AI hours
Sample
Every project, not the flattering ones
Six rules, fixed in advance, so a quarter with bad numbers still gets published.
The first edition is in preparation: measurements are being collected on current projects and will be published with N per class.
If we ever publish a number without this section, stop trusting the number.
A multiplier without N and a period · a comparison against an unnamed "industry average" · a number produced by the marketing side of the house · savings claims on total project cost beyond what the measurement supports.
Industries
From fintech and e-commerce to manufacturing and property development — the stack follows the domain, not an off-the-shelf product that fits none of them.
Ask the same questions of anyone else quoting an AI multiplier.
Because industry averages are unverifiable and self-serving. Our own historical hours are the only comparison we can actually evidence.
No. It applies to the code-writing share, which is roughly half a project. That is why we quote 30–50% on a full project rather than 2–4×.
We publish aggregates plus the method. Client-identifiable data stays private; if you need the methodology in more depth for procurement, ask and we will send it.
We publish it. A measurement programme that only reports good quarters is advertising with a spreadsheet attached.
Directly: our pricing takes the market average for the same scope and divides the programming share by 2.5. See how we price.
Manufacturer, 500+ employees. Phased migration off SAP ERP onto an open stack with custom modules — run in stages while the plant kept working.
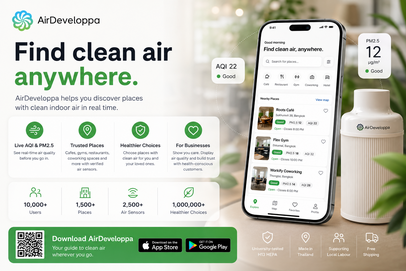
Indoor air quality finder driven by sensor data

Car-sharing app
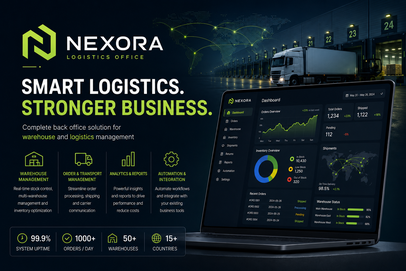
Warehouse and logistics management platform
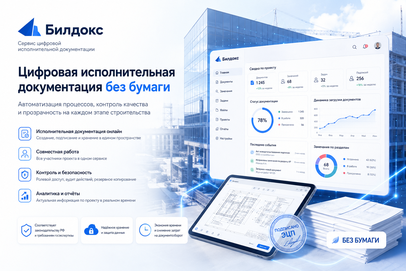
Digital as-built documentation

Telegram Mini App for currency exchange
Hold us to this
If a number on our site is not backed by the method on this page, tell us and we will fix or remove it.
The first full edition publishes once the current measurement window closes.
Tell us what you need — we'll suggest the format and the timeline. We normally reply within one business day.
or write to us directly